TB Crown Jewel 1 + 2
by C. Casquatch
adding notes for the future for ntds.dit while completing some sherlocks to help solidify understanding of event logs.
I was too lazy to document the first three-or-so questions I answered for the first crown jewel sherlock SO this TidBit is mid through CROWN JEWEL 1 (Crown Jewel 2 is below and these are retired sherlocks)
Here we go:
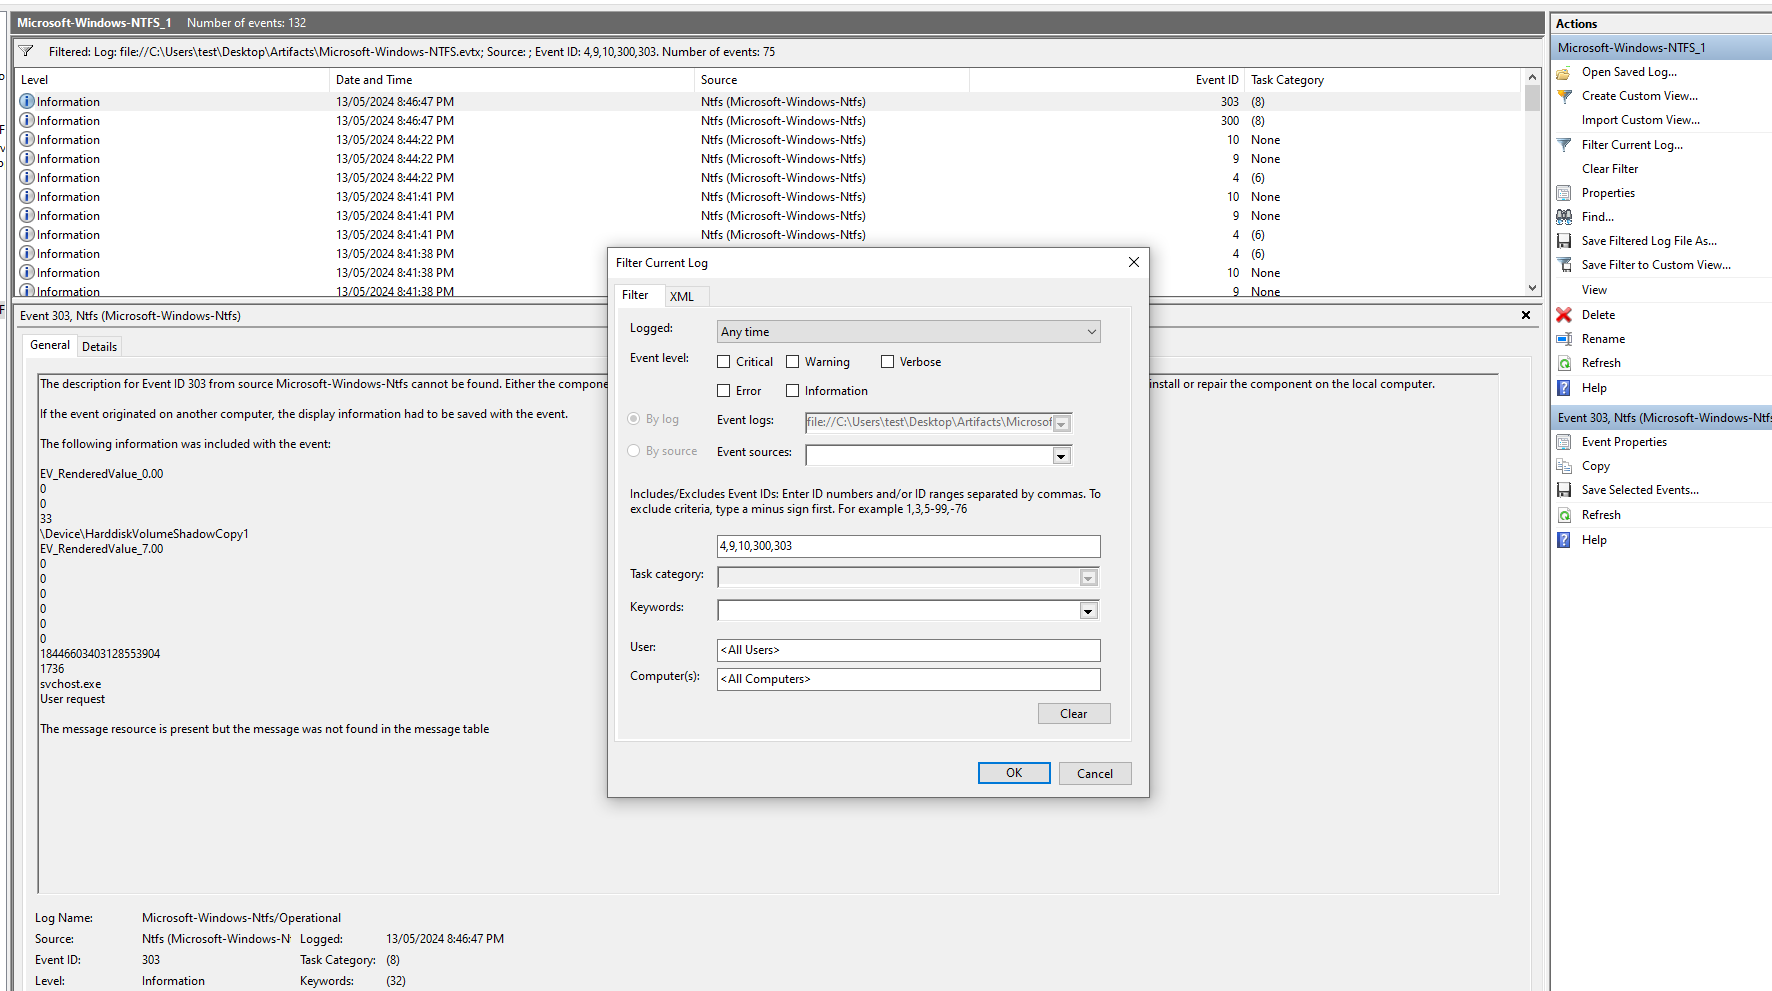
Find the assigned Volume ID/GUID value to the Shadow copy snapshot when it was mounted. Hint: Analyze Microsoft-Windows-NTFS event logs. Filter for event ID 4,9,10,300 and 303. This will filter for only the NTFS volumes mount and dismount events. Focus on the events around the timeframe of the incident. Then look for the Volume Correlation ID in the scoped events.
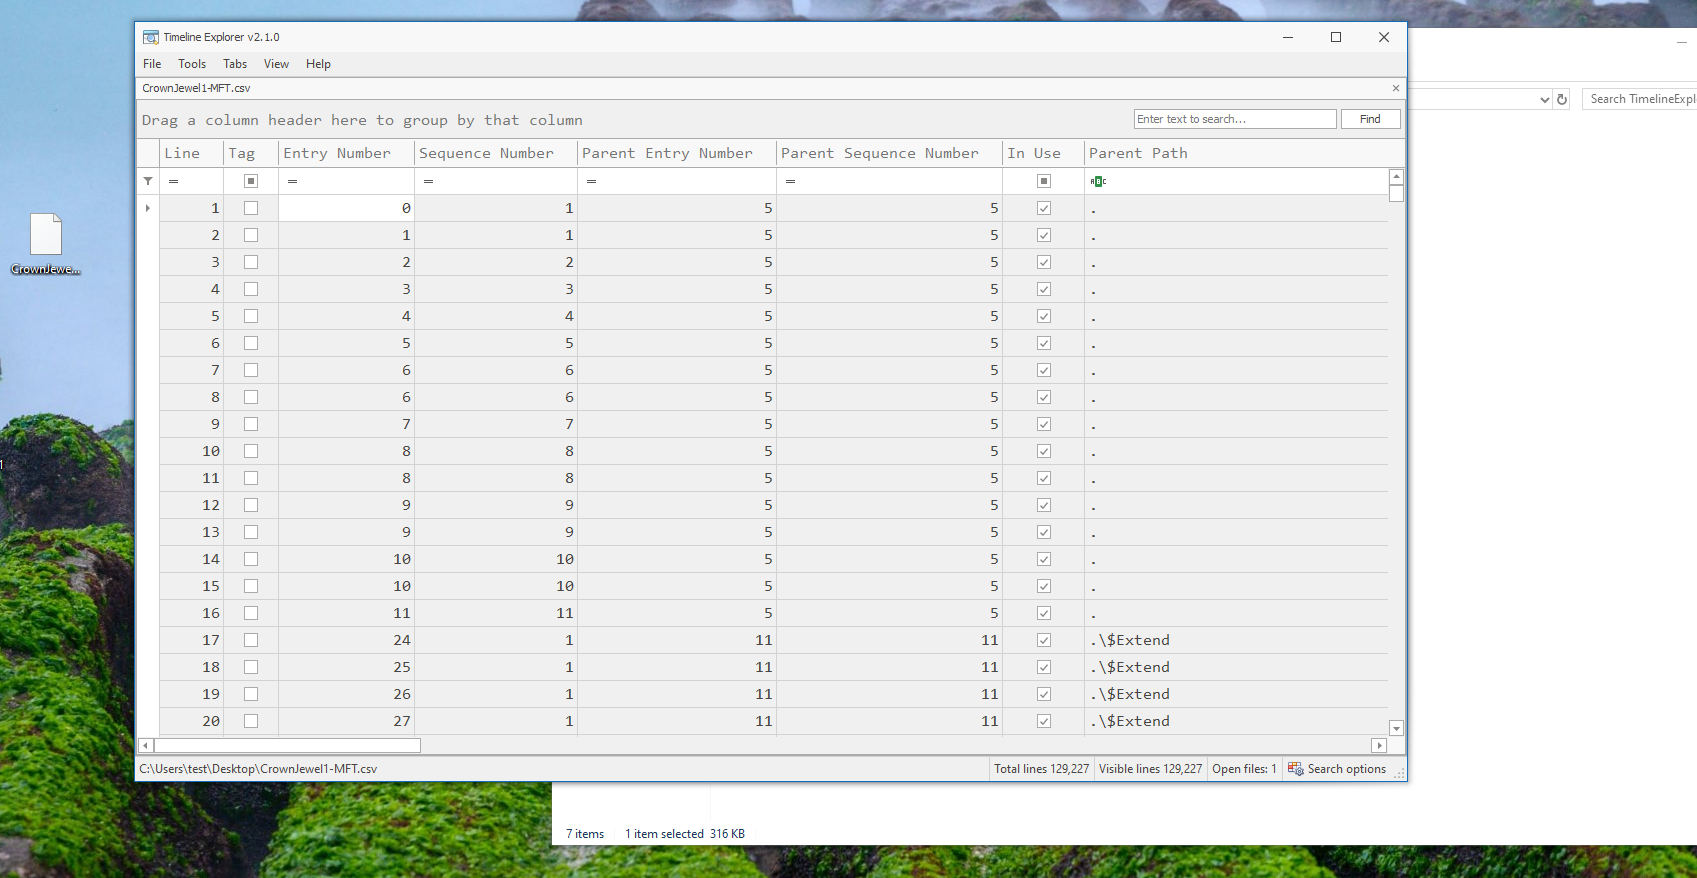
Our next question is - Identify the full path of the dumped NTDS database on disk. To do this we need to parse the MFT file using MFTeCMD. Open the resultant csv in the timeline explorer tool, then filter for the date of the incident (14 May 2024). In the file name field, filter for the name NTDS.dit. Now identify any suspicious/odd path where this database was created which should not be normal.
To parse using MFTECmd command:
MFTECmd.exe -f "Path\to\$MFT" --csv . --csvf CrownJewel1-MFT.csv
Use timeline explorer to open the file; you can drag and drop the csv file into the explorer window. Now add a filter for “NTDS.dit” in File name field in csv.
Next question for us: When was newly dumped ntds.dit created on disk?
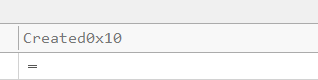
Let’s Look for the Created0x10 column value from previously identified entry, scroll right.. Look for created timestamp for this file.
Next question! A registry hive was also dumped alongside the NTDS database. Which registry hive was dumped and what is its file size in bytes?
In the MFT results file, filter for the identified folder path where the attacker dumped the NTDS database. It will display any other file created on that path as well. We can add a filter for the path name we identified in the Parent path field.

after getting the name of the file, we can scroll across the page to the file size column and claim our reward.
First crown jewel is done; let’s lay the ground work for the next one below.
CROWN JEWEL 2
This is similar to the first one. we are working with NTDS.dit again. I’m a sucker for them Zimmerman tools.
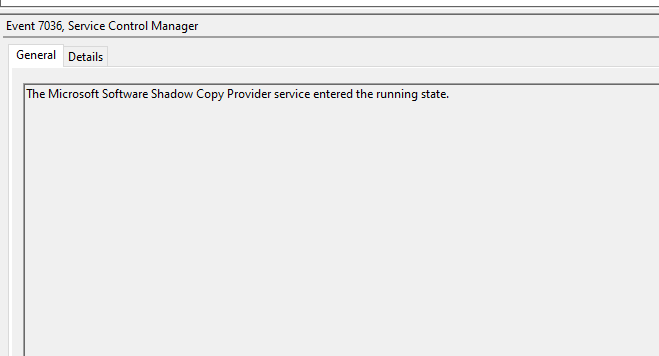
The first question is: When utilizing ntdsutil.exe to dump NTDS on disk, it simultaneously employs the Microsoft Shadow Copy Service. What is the most recent timestamp at which this service entered the running state, signifying the possible initiation of the NTDS dumping process?
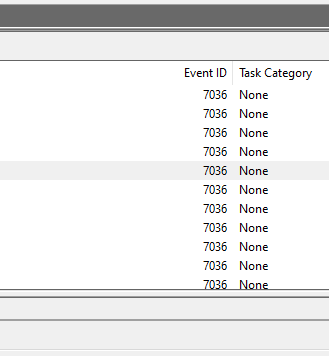
OK, In the System event log, we can filter for Event ID 7036 and look for the mentioned service name (Microsoft Shadow Copy Service). Once spotted, go to the details tab, and expand the System option to get the event time in UTC.
More about 7036: https://kb.eventtracker.com/evtpass/evtpages/EventId_7036_ServiceControlManager_46021.asp
sort by lowest to highest and find the earliest time for this event.
sort by lowest to highest and find the earliest time for this event.
then go into the details tab and under ‘system’ grab the time stamp
for question 2 (Identify the full path of the dumped NTDS file.): The hint: In Application Event Log, filter for Event ID 325. This Event ID is recorded whenever a new database (new copy of NTDS.dit database) is created by the database engine.
after filtering on event 325 - make sure to look in the event with the almost-same time stamp as the previous question.

question 3 is the time that the last question was dumped….
Question 4! When was the newly dumped database considered complete and ready for use? hint: ‘In Application Event Log, filter for Event ID 327. This Event ID is recorded whenever a newly created database (new copy of NTDS.dit database) is detached by the database engine and marked ready to use.’
there’s only two outputs here - which one, which one. Both of them have the same time, so..
question 5! Event logs use event sources to track events coming from different sources. Which event source provides database status data like creation and detachment? Hint: Look at the Event source in Events from question 2 to 4.
juicy.
In case anyone(me) missed it ~source~ is a column at the top. So it would be the name below that..

Question seis: When ntdsutil.exe is used to dump the database, it enumerates certain user groups to validate the privileges of the account being used. Which two groups are enumerated by the ntdsutil.exe process? Also, find the Logon ID so we can easily track the malicious session in our hunt. Words to note: user groups, privileges, account, logon ID = security log Hint : In Security Logs, filter for Event ID 4799 . Look for Events in between the timeframe of incident identified so far. Identify the events where process name is C:\Windows\System32\ntdsutil.exe .
Now we open Security log and filter for Event ID 4799. Keeping the timeline in mind, we need to find events related to ntdsutil process. We find many events of such criteria all occurring in total of 2 seconds , also falls under the timeframe of our incident.
if you’re good at XML queries - look for:
C:\Windows\System32\ntdsutil.exe
Or if you are scrolling manually - which two groups pop-up all the time? They rhymne with shmerministrator and shmackupshmoperators.
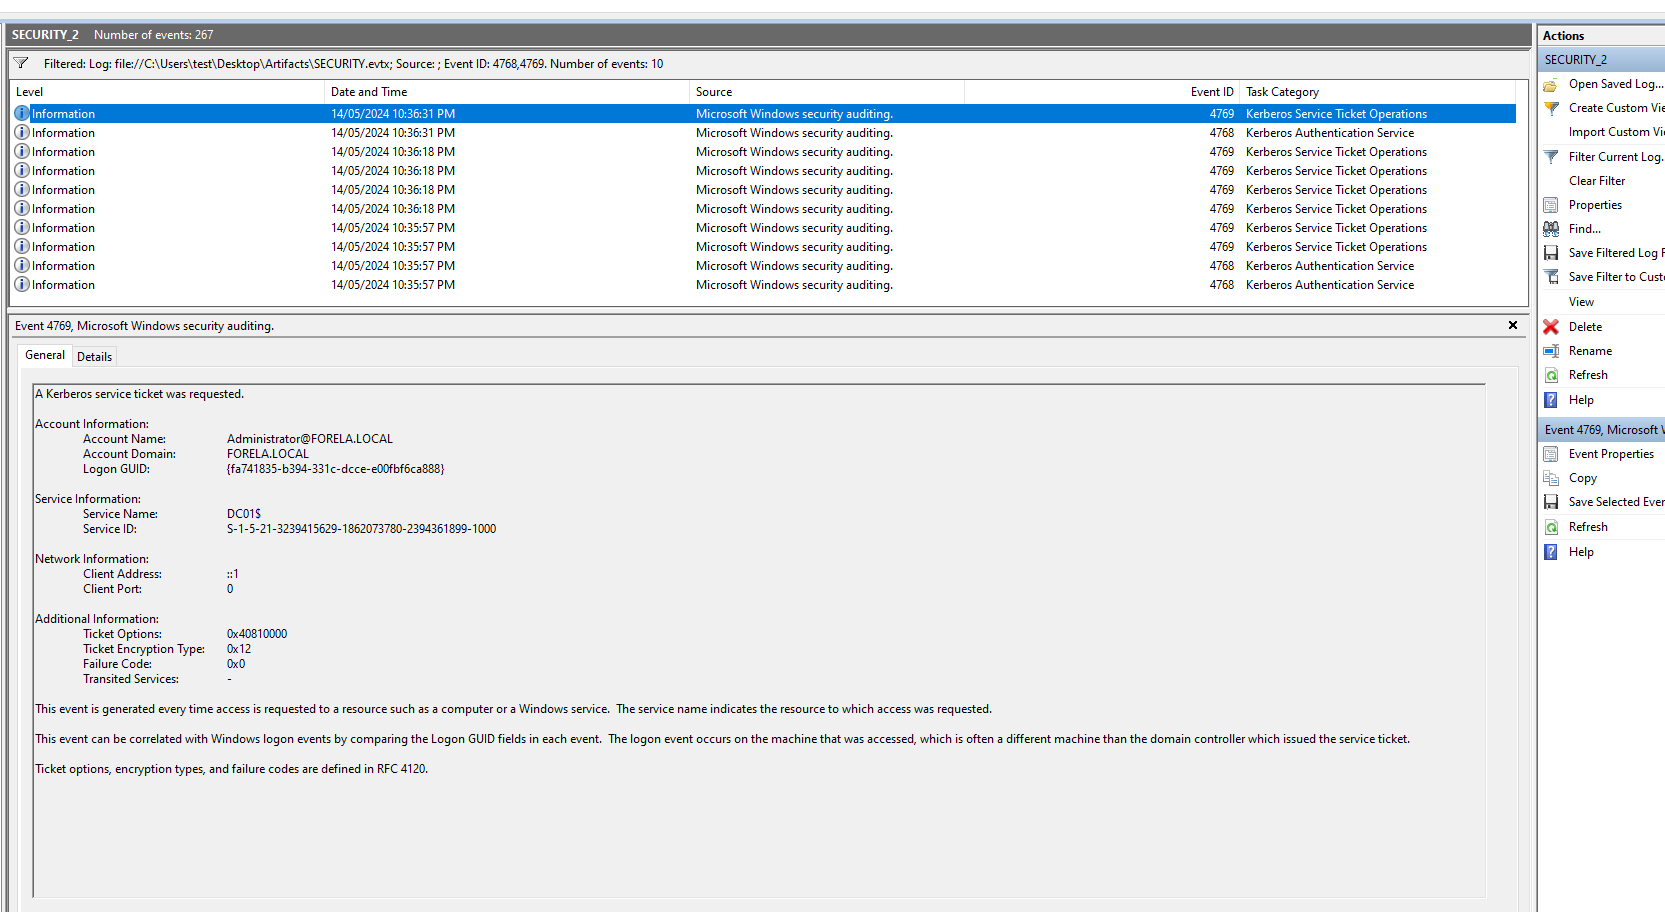
Question 7: Now you are tasked to find the Login Time for the malicious Session. Using the Logon ID, find the Time when the user logon session started.
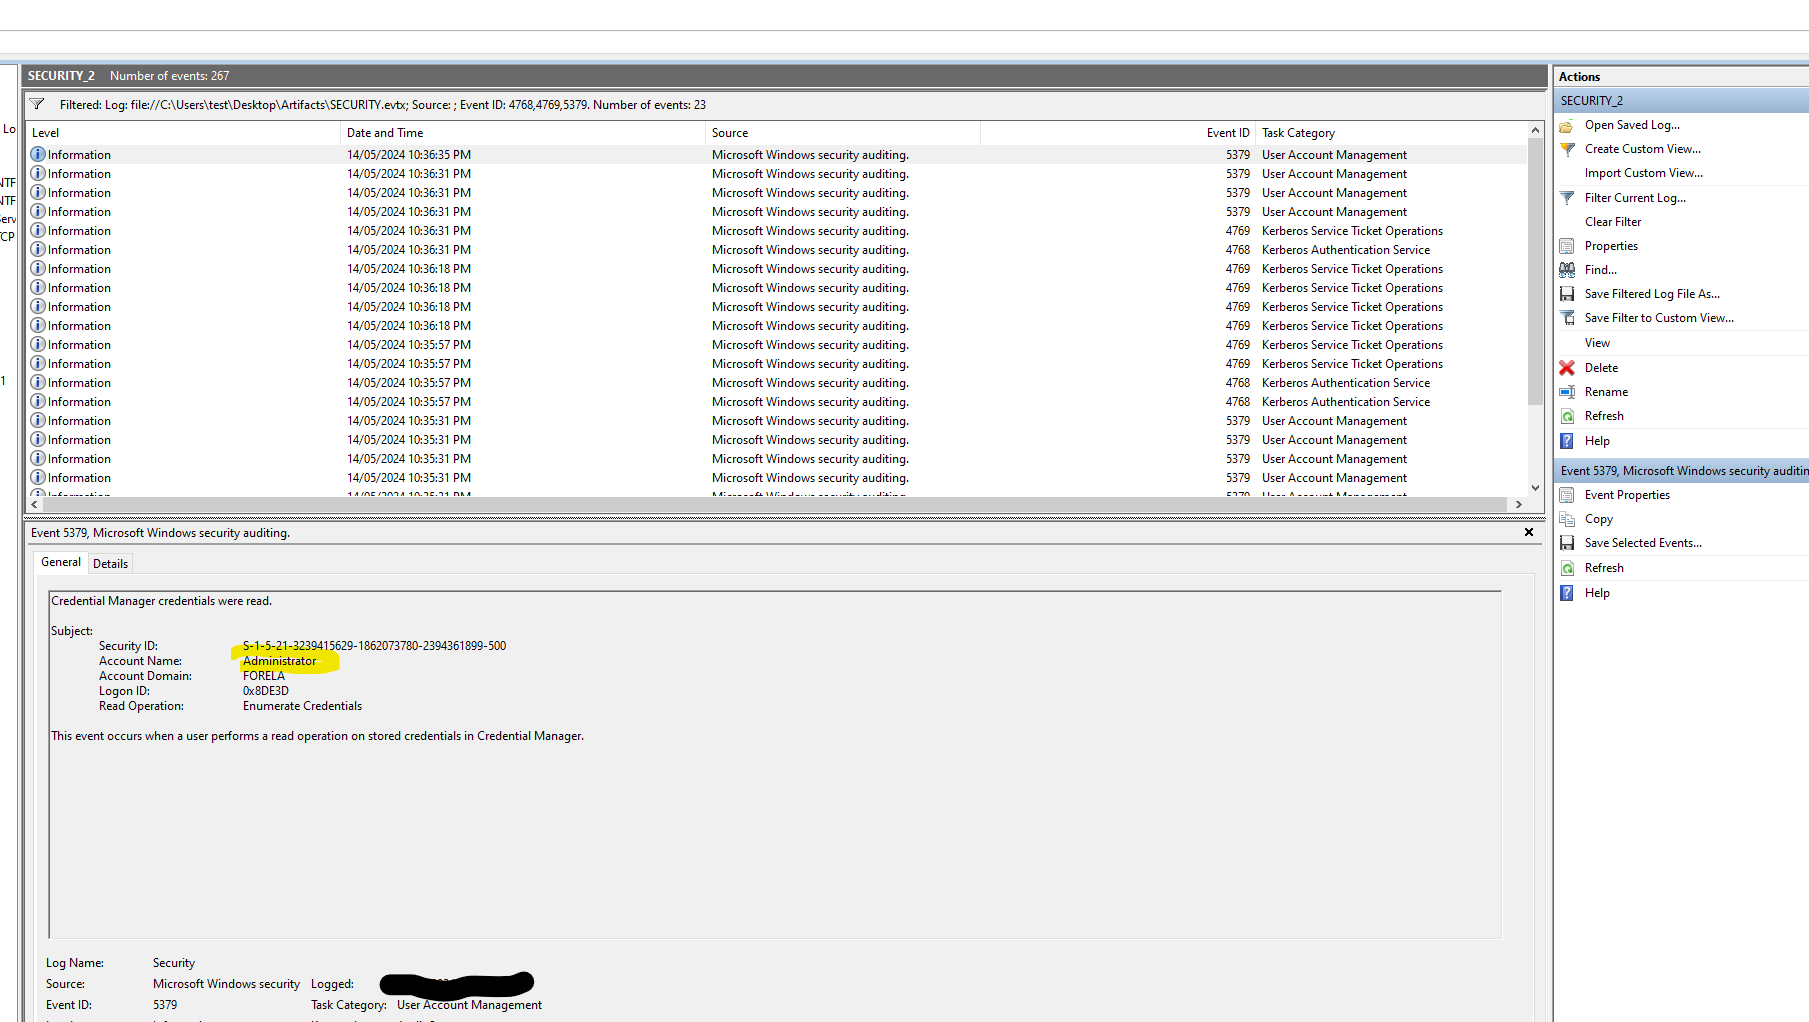
Hint: Since this is a domain environment we would want to use Kerberos events to find the timestamp. Filter for Event ID 4768 and 4769. From here identify the Event Where Account Name is a user account name and not any service or machine account (Starting with a $) in the event 4768. This event will be immediately followed by a 4769 event with the same Subject Username. Now add another event id 5379 in the filter. These new events have the Logon ID we are tracking. Notice that timestamp of all these events are the same as they happened right after each other. This will be the logon time
Stay in the same vent viewer for security logs.
Hint: Logon IDs are used to track Logons on windows systems. We filter for Event ID 4768,4769 and 5379, and
look for events with a user account name and not a service/machine account.